
In the previous Insight, From Statistics to Intelligence: Building an Engine That Interprets Behaviour, we reached the point of building something that goes beyond a dashboard.
Metrics.
Opportunities.
Confidence.
Benchmarks.
Signals.
Archetypes.
Evidence.
Counter-evidence.
From an analytical perspective, that is an achievement.
From the user’s perspective, it can become a problem.
The more capable the system becomes at interpreting data, the greater the amount of information it could display.
And if we show everything at once, we risk a paradox:
we have reduced complexity in the data only to recreate it in the interface.
This is where UX stops being an aesthetic matter.
It becomes part of the intelligence system.
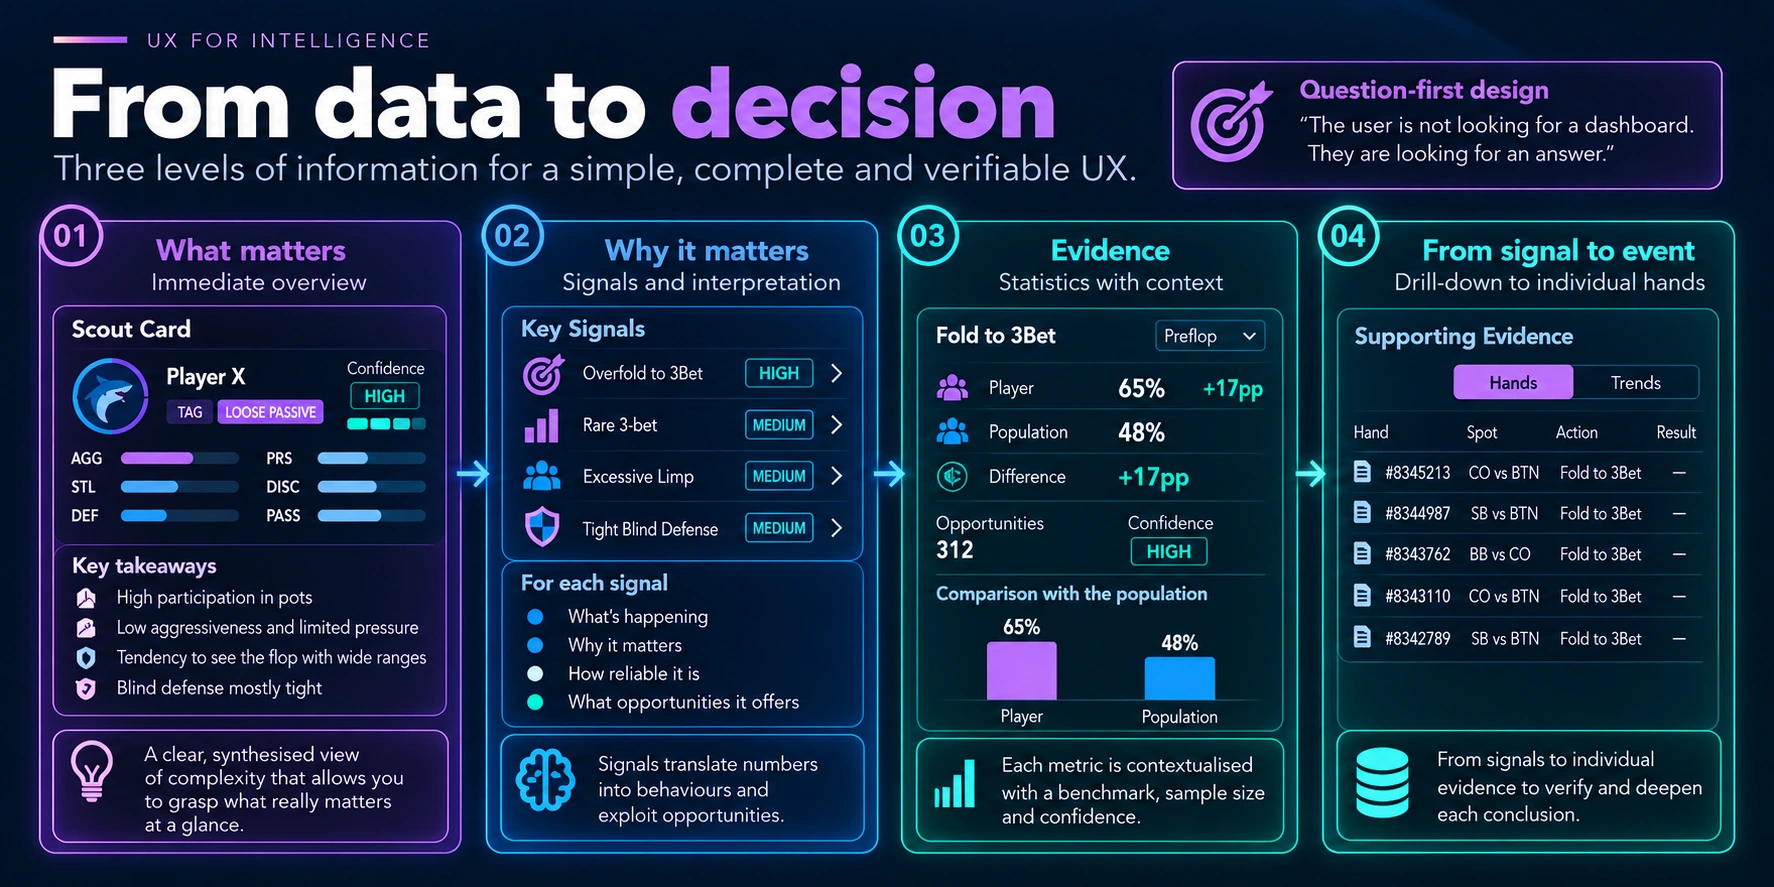
The User Is Not Looking for a Dashboard
When we design a data-intensive product, it is easy to start from what we have built.
Do we have twenty statistics?
We create twenty widgets.
Do we have benchmarks?
We add a column.
Do we have confidence?
We add a badge.
Do we have signals?
We create another section.
Technically, it works.
But the result risks becoming what I call dashboard theatre: an interface that appears rich, full of numbers, charts and indicators, but transfers all the interpretative work to the user.
The point is that the user is not looking for a dashboard.
They are looking for an answer.
In my case, questions such as:
What kind of behaviour am I observing?
Which patterns deserve attention?
How much confidence can I place in this conclusion?
What data supports it?
Interface design should begin with these questions.
Not with the components available.
Question-First Design
This led me to a distinction that I find useful.
Component-first design
I have a table, a chart and a card. What data can I display in them?
Question-first design
What question does the user need to answer? What is the minimum amount of information required to help them?
The second approach changes how we organise the interface.
It does not mean removing detail.
It means deciding when to show it.
Three Levels of Information
The structure that began to work best was very simple:
Level 1 → What matters
Level 2 → Why it matters
Level 3 → Evidence
In other words:
overview → explanation → evidence
At the first level, I want to understand immediately what deserves attention.
At the second, I want to understand why.
At the third, I want to be able to verify the evidence.
This hierarchy makes it possible to preserve two qualities in the same product that may appear to conflict:
simplicity and explainability.
The interface can be simple without being superficial.
The complexity remains available.
It is simply not displayed all at once.
Progressive Disclosure
This is where progressive disclosure comes into play.
Instead of presenting every available piece of information immediately, the interface creates a path.
In my case:
Scout Card
↓
Signals
↓
Statistics
↓
Hands
Each level answers a different question.
The Scout Card says:
what kind of behaviour am I observing?
The signals explain:
which patterns produced this interpretation?
The statistics show:
which numbers support those patterns?
Finally, the individual hands make it possible to verify:
which real events generated those numbers?
This structure creates an important property:
every synthesis can be traced back through the system to the facts.
I do not have to choose between a simple UI and a verifiable one.
I can have both.
The Scout Card as Cognitive Compression
One of the most interesting experiments was the Scout Card itself.
The aim was not to create a more attractive card.
It was to compress a large amount of information into a representation that could be read quickly.
Instead of immediately displaying dozens of statistics, the card summarises elements such as:
- archetype;
- confidence;
- aggression;
- propensity to steal;
- defence;
- pressure;
- discipline;
- passivity.
It does not replace the statistics.
It compresses them.
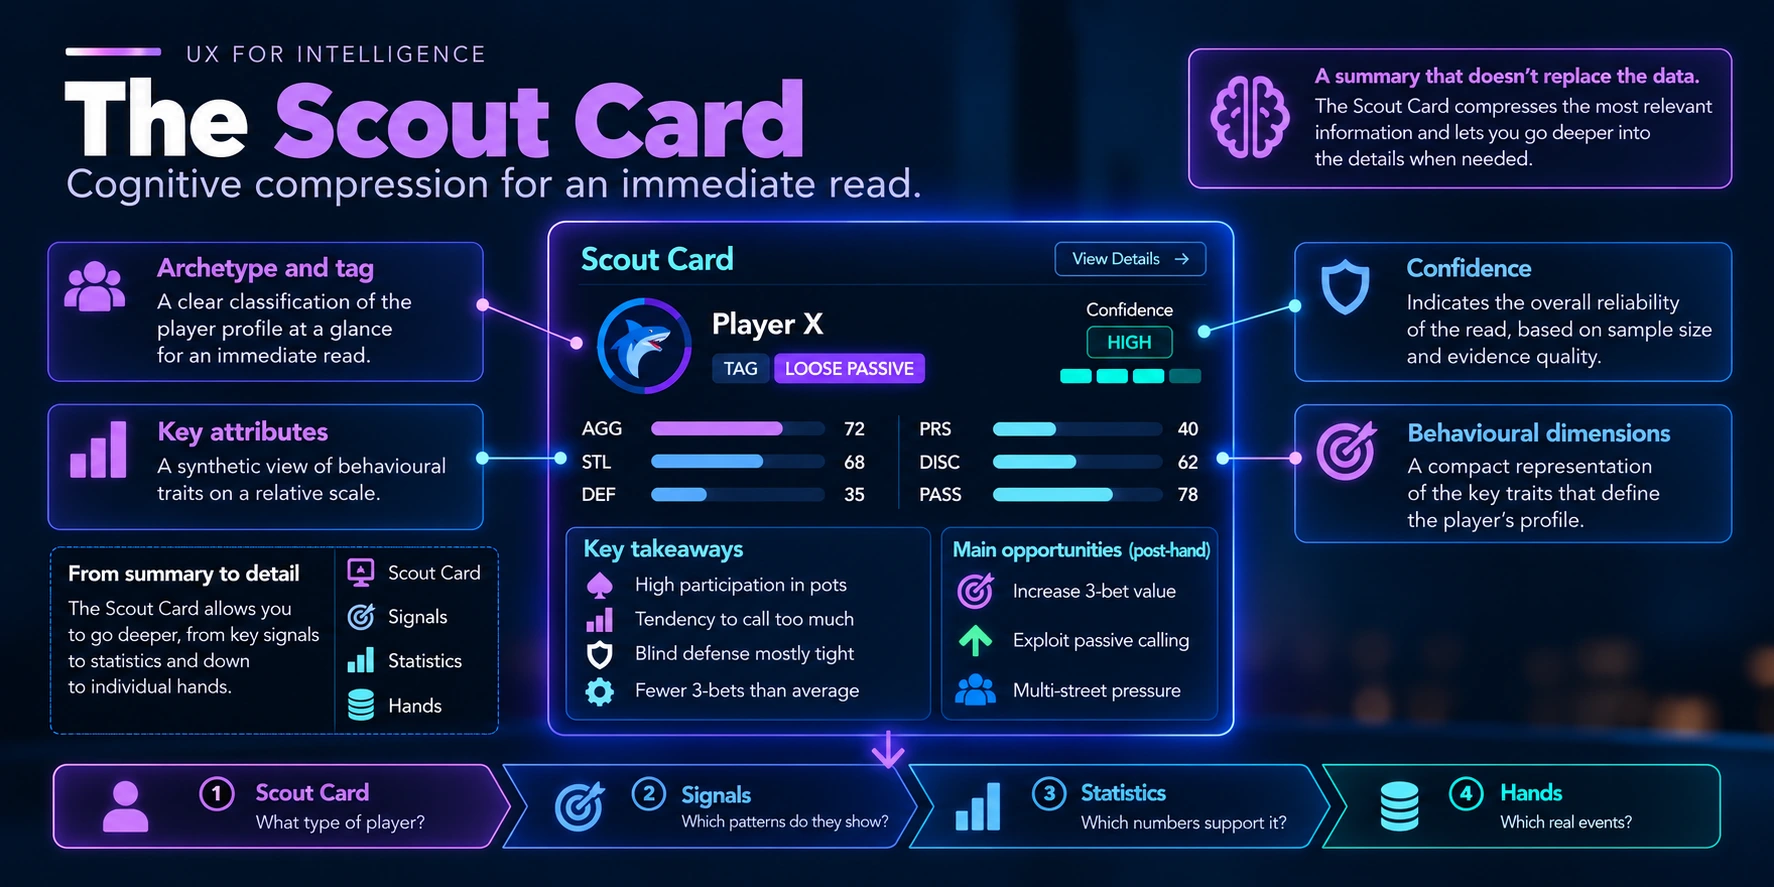
This distinction is important.
A good synthesis does not remove information.
It reduces the cognitive cost of beginning to understand it.
The user can stop at the Scout Card if a quick interpretation is enough.
Or they can drill down into the signals.
Then into the metrics.
Then into the evidence.
Information Density Does Not Mean Showing Everything
An analytical interface can be highly information-dense and remain readable.
The problem is not necessarily the amount of information.
It is the amount of information without hierarchy.
If colour, size, position, typography and space all carry the same weight, every element competes with the others.
The user has to decide where to look without guidance.
An effective hierarchy should instead suggest:
- look at this first;
- if it interests you, explore further here;
- if you want to verify it, this is the evidence.
The UI thus becomes a guide to reading the information.
Not merely a container for data.
The State of the Data Must Also Be Visible
A number can be correct and, at the same time, unreliable.
This had already emerged when discussing sample size and confidence.
In the interface, however, that distinction must be perceptible.
Imagine:
3Bet: 18%
On its own, it may seem extremely significant.
But if it derives from:
5 opportunities
the interpretation changes.
This is why confidence and sample size should not be hidden on a secondary screen.
They should sit close to the metric whenever they directly affect its meaning.
They do not necessarily need to dominate.
But they need to be available.
Ranking Without Context
The same problem arises when we begin to rank players or behaviours.
A ranking such as:
Player A — 72%
Player B — 68%
Player C — 64%
appears very precise.
But it could conceal:
Player A — 72% — 18 opportunities
Player B — 68% — 340 opportunities
Player C — 64% — 512 opportunities
The ranking is not false.
It is simply incomplete.
And the interface can amplify that incompleteness by turning a numerical difference into a visually powerful hierarchy.
This is why ranking, sample size and confidence should be designed together.
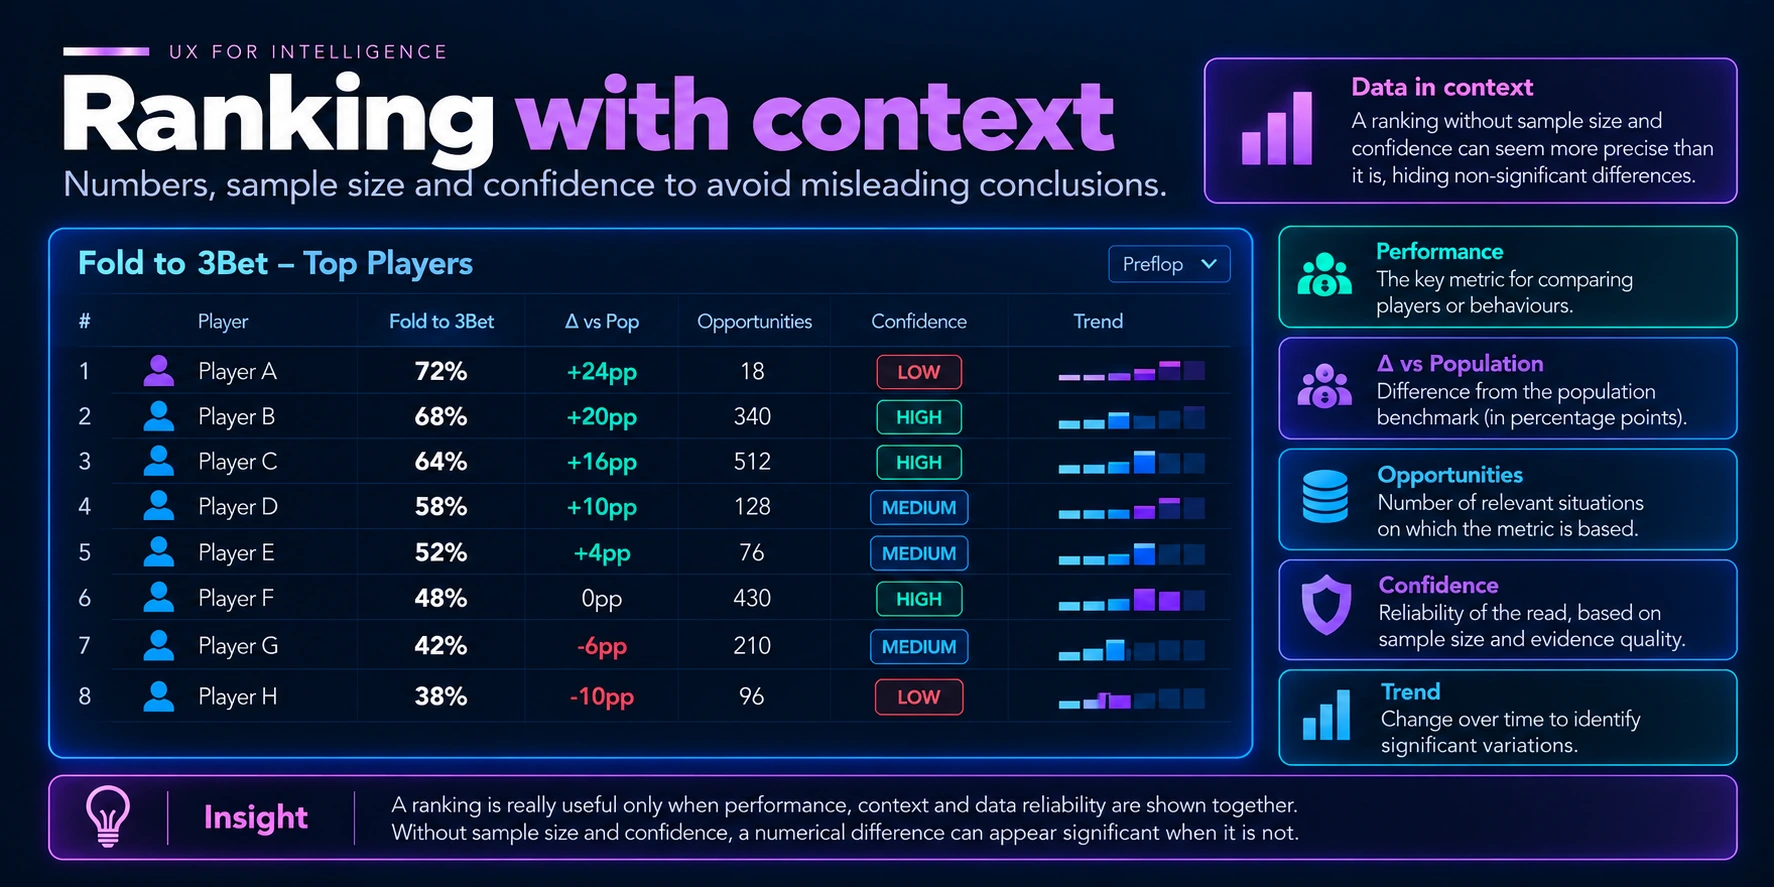
UX should not only make data readable.
It should avoid making it appear more certain than it really is.
The Benchmark Should Sit Close to the Metric
Then there is the question of context.
If I show:
Fold to 3Bet: 65%
and the population benchmark appears three screens later, I am asking the user to keep the first value in mind while searching for the second.
That is an unnecessary cognitive cost.
It is much better to show:
Player 65%
Population 48%
Δ +17pp
When comparison is part of the interpretation, it should also be part of the representation.
This principle may seem obvious.
But applying it consistently makes a considerable difference to the readability of an analytical product.
Explainability Does Not Mean Showing Everything Immediately
Another risk is interpreting explainability as an obligation to show every detail.
That is not the case.
A signal might initially appear as:
Overfold to 3Bet
Confidence: HIGH
If the user wants to understand why, they can open it.
At that point, they find:
Fold to 3Bet → 65%
Population → 48%
Difference → +17pp
Opportunities → 312
together with the relevant supporting evidence and counter-evidence.
If they want to go deeper still, they can reach the underlying events.
Signal
↓
Metric
↓
Opportunities
↓
Events
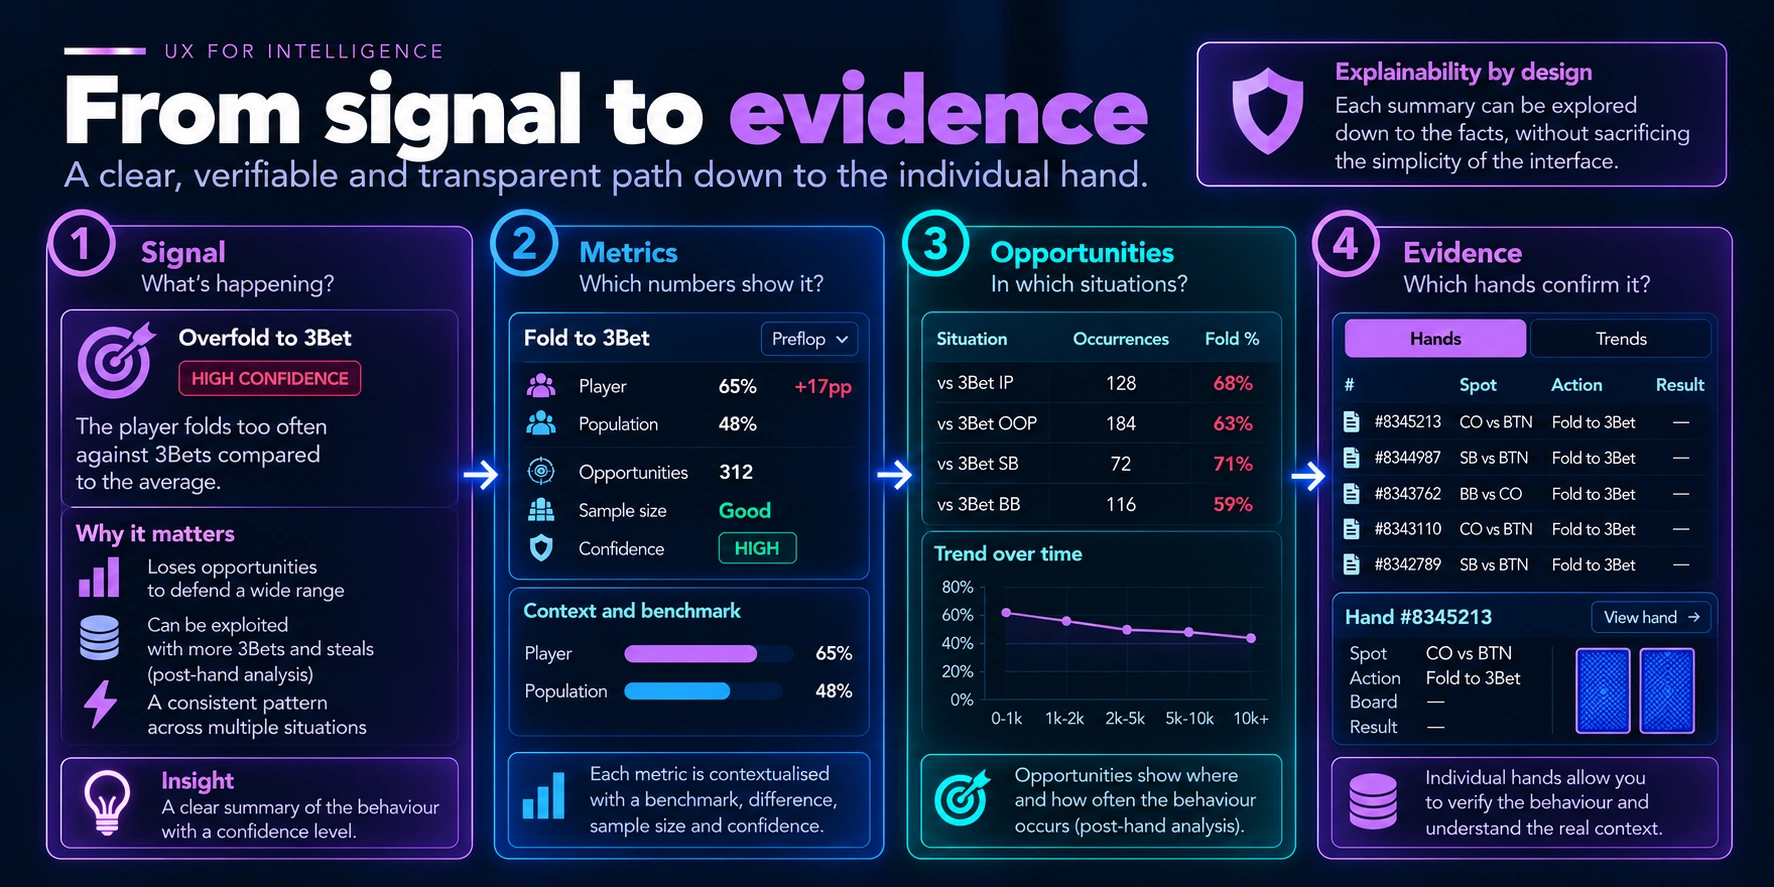
This is the point at which progressive disclosure and explainability become the same architecture viewed from two perspectives.
One concerns how much to show.
The other concerns how much can be verified.
The UI as Part of the Model
While working on this problem, I realised that some decisions that appeared to concern the frontend were actually revealing domain requirements.
If I want to display confidence alongside a statistic, I need a consistent definition of confidence.
If I want to compare a player with the population, I need compatible benchmarks.
If I want to enable drill-down from a signal to its evidence, I need to preserve that relationship in the model.
If I want to display counter-evidence, the engine needs to produce it.
The UI does not therefore simply arrive at the end of the process.
It can become a tool for discovering what is missing from the architecture.
A screen that is difficult to explain often points to a model that is difficult to explain.
The Best Interface Does Not Show How Intelligent the System Is
When we build something technically complex, it is natural to want to show it.
More metrics.
More charts.
More indicators.
More automation.
But the user should not perceive the system’s complexity as proof of its value.
They should perceive clarity.
If a Scout Card is backed by hundreds of events, dozens of metrics, benchmarks and interpretative rules, the interface does not necessarily need to display all of them.
It needs to make them available when required.
The difficult work remains behind the interface.
The decision becomes simpler in front of it.
From Complexity to Decisions
Looking at the entire pipeline, the path became:
raw data
→ facts
→ statistics
→ confidence
→ benchmark
→ signals
→ intelligence
→ UX
→ decision
The final step is not a cosmetic detail.
We can have reliable data and sound intelligence, but if the user cannot understand:
- what matters;
- why it matters;
- how reliable it is;
- where it comes from;
the system has not yet completed its work.
This is why I consider UX part of intelligence.
Not because it should make decisions on the user’s behalf.
But because it must transform the system’s internal complexity into something a person can understand, verify and use.
The rule I take away is simple:
show what matters first, without hiding what is needed to verify it.
Originally published on LinkedIn on 13 September 2026. This edition is part of Lead From Tech Insights.