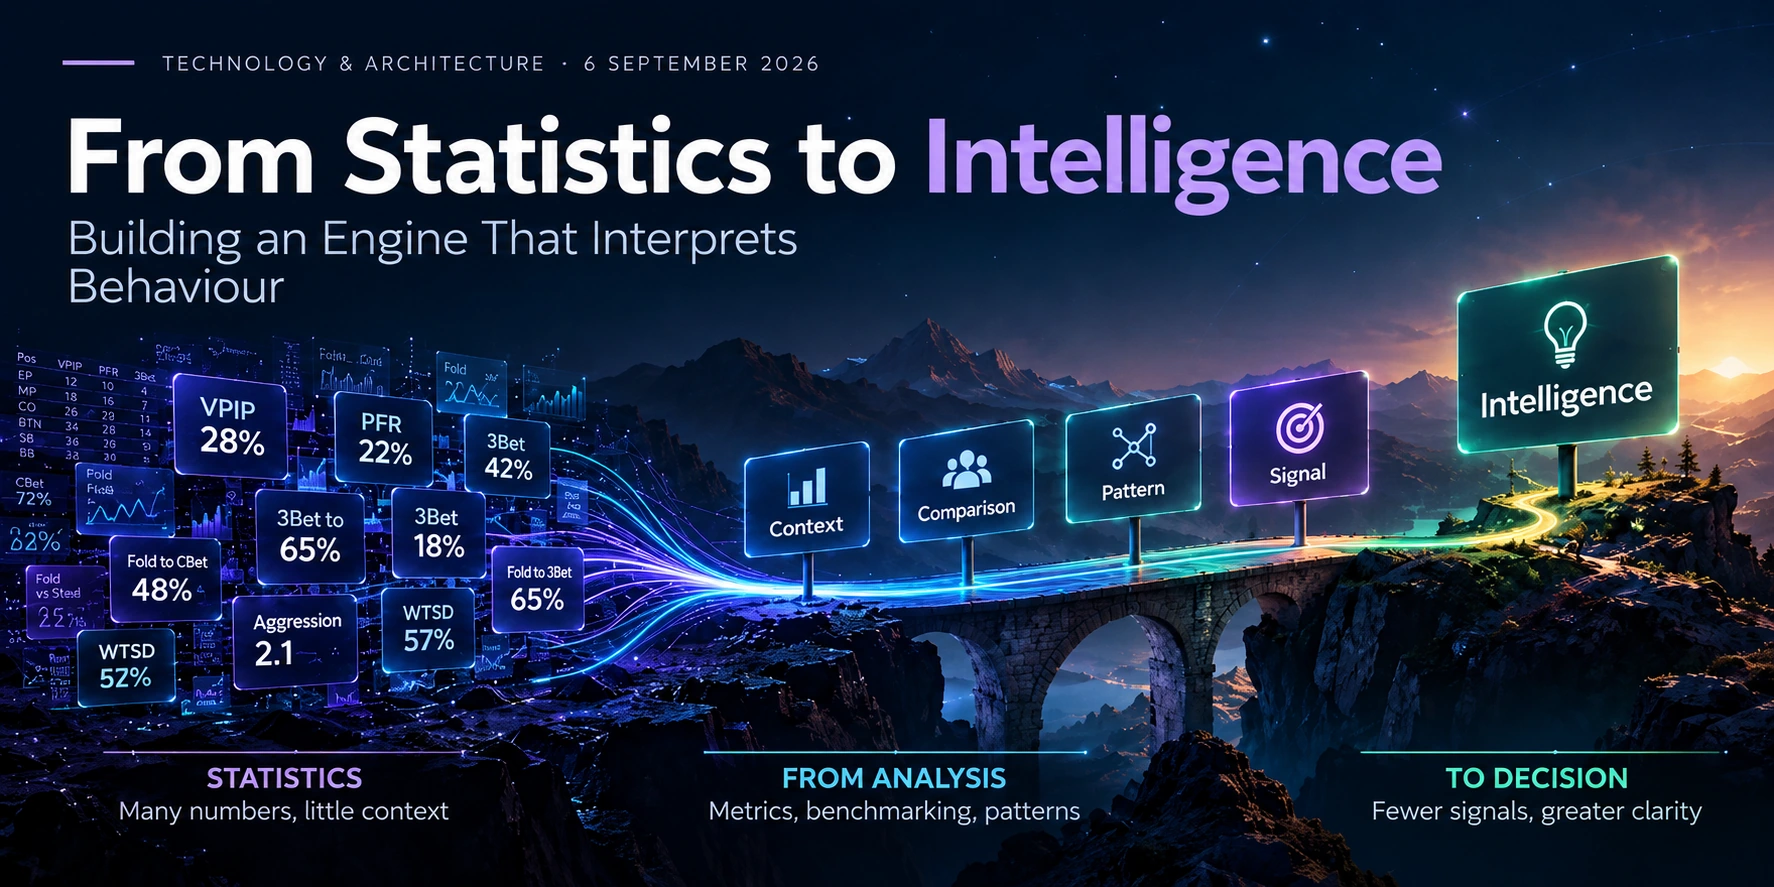
In the previous Insight, Numbers Are Not Enough: Sample Size, Opportunities and Confidence, we reached a precise point.
A statistic, on its own, is not enough.
To interpret it, we need at least the context in which it was observed, the number of opportunities that generated it and an indication of the strength of the available evidence.
The progression was:
reliable data → opportunity → statistic → sample size → confidence → signal
But that final element opens up a new question.
When can a statistic become a signal?
And above all: what happens when multiple signals begin to describe the same behaviour?
This is where an analytics system can begin to transform into something different.
An intelligence engine.
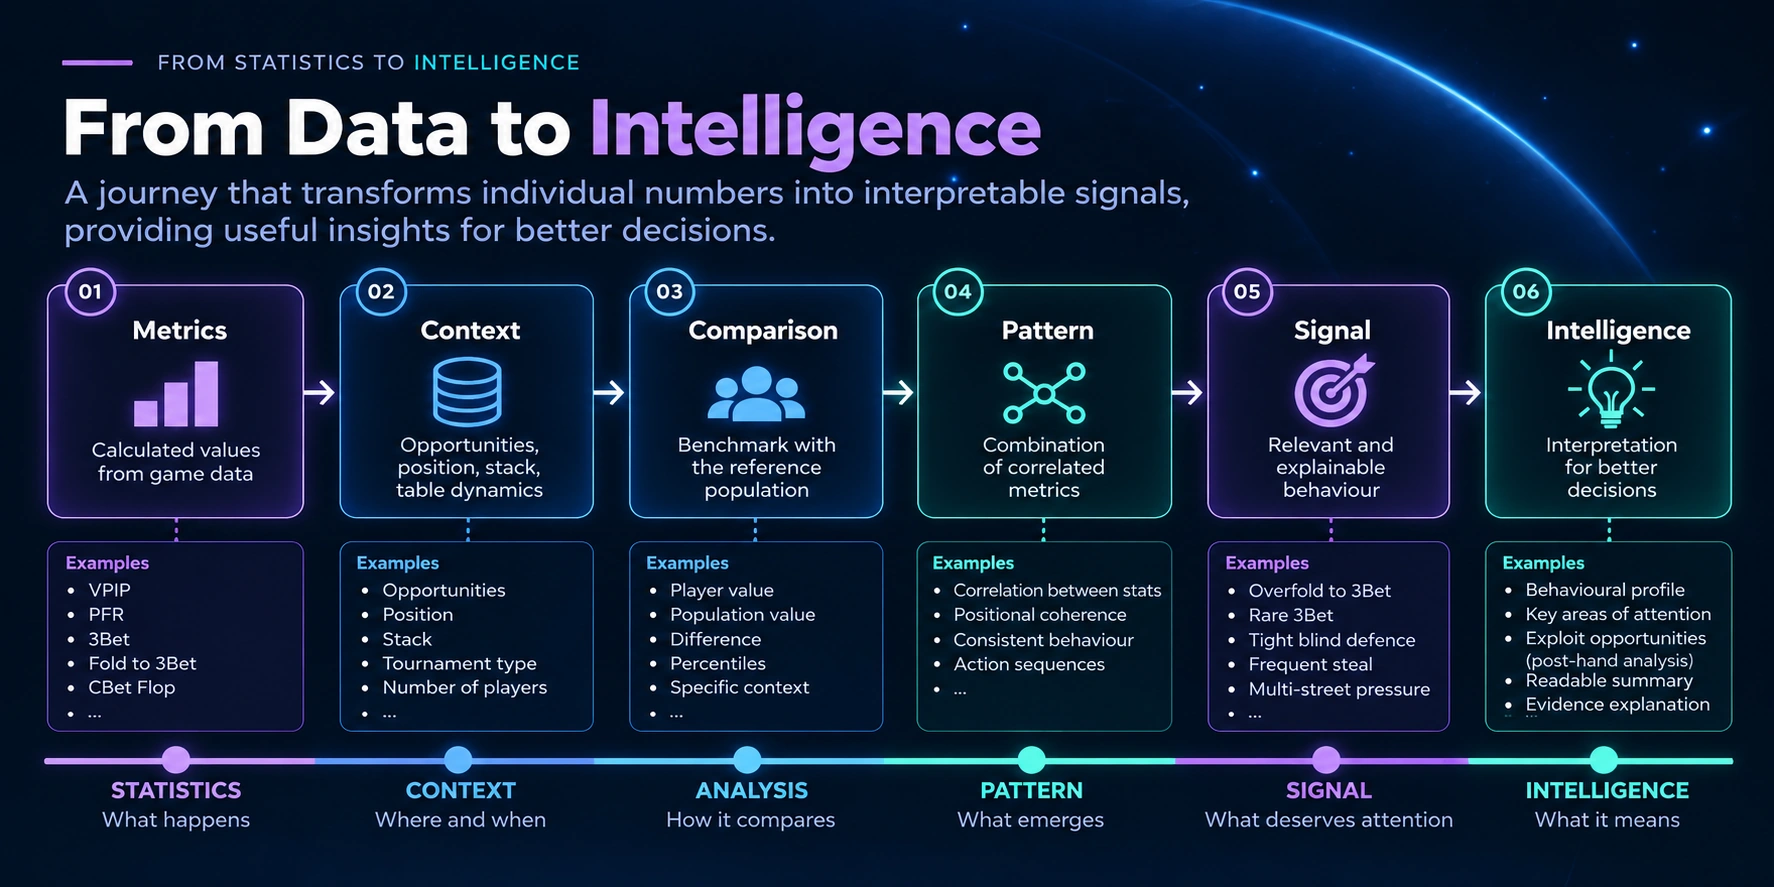
A dashboard does not interpret
Imagine looking at a profile containing dozens of statistics:
- VPIP;
- PFR;
- 3Bet;
- Fold to 3Bet;
- ATS;
- Fold BB vs Steal;
- CBet Flop;
- CBet Turn;
- Fold to CBet;
- postflop aggression;
- frequencies by position.
They could all be calculated perfectly.
They could have sufficient samples.
They could even show opportunities and confidence.
Yet one question would remain:
what does all this mean?
The dashboard describes.
The user interprets.
The problem I wanted to address was precisely that space between the two.
Not to replace the user’s decision.
But to reduce the work required to reach the observations that genuinely deserve attention.
A metric is not a pattern
Take an apparently simple statistic:
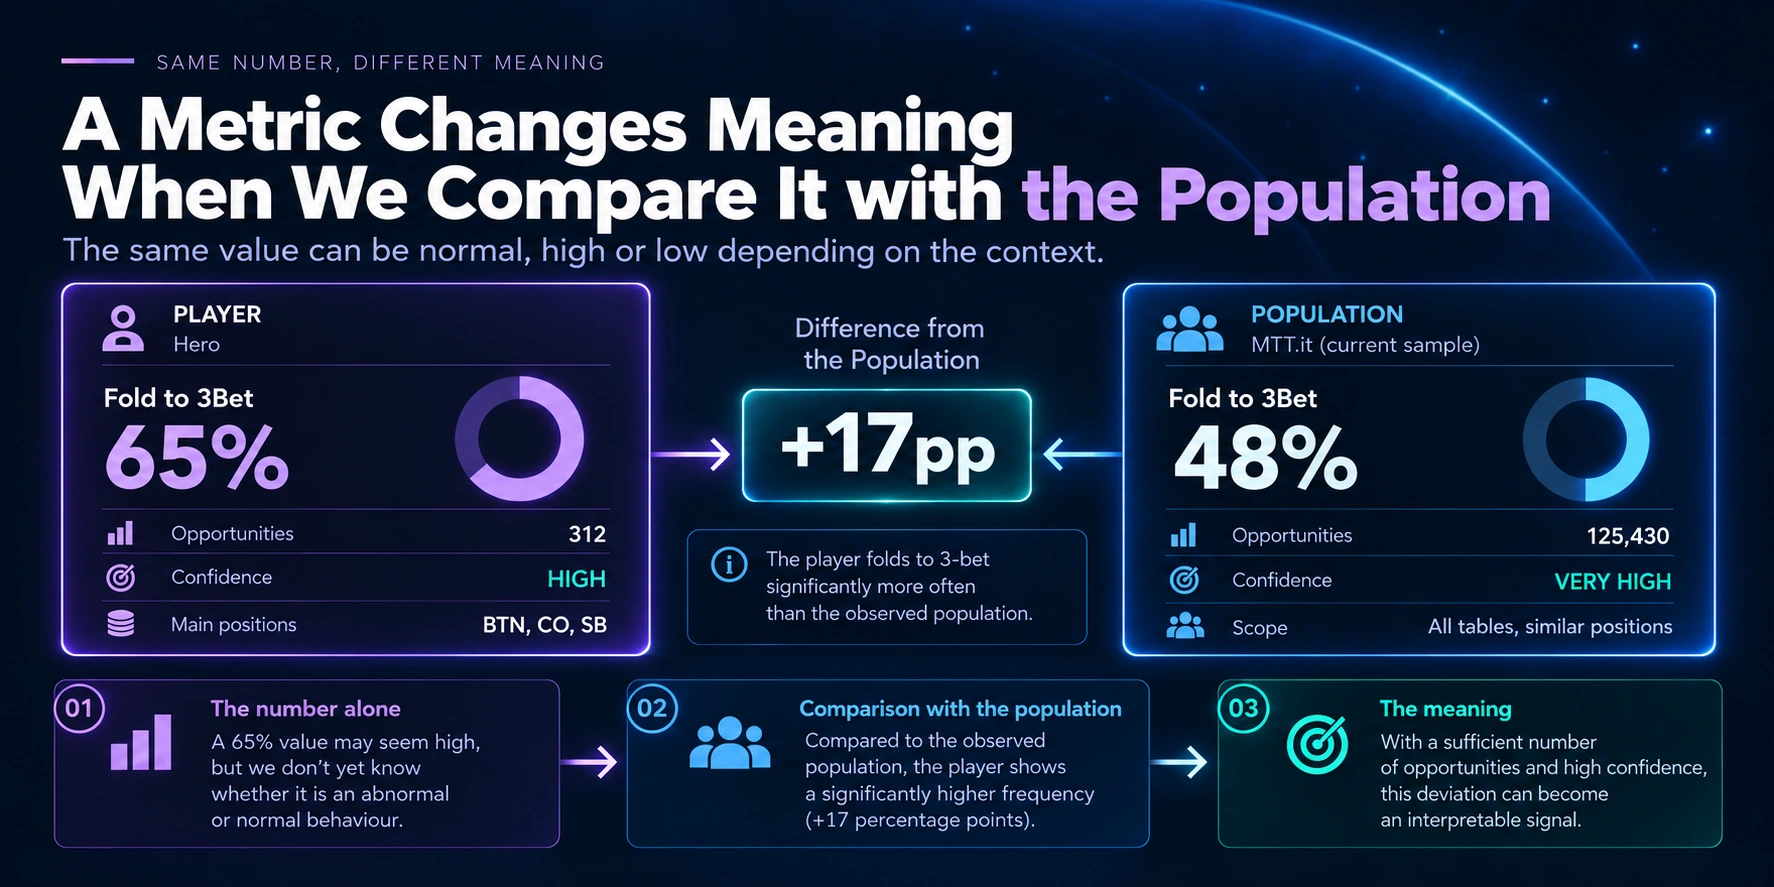
Fold to 3Bet = 65%
In isolation, it says little.
It could be high.
It could be normal.
It could depend on the type of players represented in the sample.
It could derive from very few opportunities.
It could change significantly by position.
To begin interpreting it, we need context.
For example:
Player: 65%
Population: 48%
Difference: +17 percentage points
At this point, we are no longer observing only a value.
We are observing a deviation from a reference.
And if that deviation is supported by a sufficiently reliable sample, it can begin to become a signal.
From value to signal
The conceptual transition is important.
A metric answers:
“how often does this behaviour occur?”
A signal instead attempts to answer:
“is this behaviour significant enough to deserve attention?”
In the engine I was building, a signal therefore could not arise from a simple threshold.
I did not want something like:
Fold to 3Bet > 60% → overfolder
Because that would be too fragile.
A more useful rule must be able to consider simultaneously:
- the metric value;
- opportunities;
- confidence;
- the population benchmark;
- distance from the benchmark;
- any positional context;
- other consistent evidence;
- possible counter-evidence.
The signal therefore becomes the result of a combination of evidence, not of a single number.
The benchmark changes the question
Comparison with the population was one of the most important steps.
Without a benchmark, I can say:
“this player folds to 3-bets 65% of the time.”
With a benchmark, I can say:
“in the available sample, this player folds to 3-bets more frequently than the observed population.”
That is a substantial difference.
The first statement describes.
The second contextualises.
But caution is needed here too.
The benchmark does not represent a universal truth.
It represents the population observed by the system at that point in time.
Change the dataset and the reference may change.
For this reason, population intelligence must also preserve the connection with the data from which it derives.
A signal must be able to explain why it exists
If the system displays:
Rare 3Bet
the first question should be:
why?
If the answer is hidden in the code, we have built a black box.
Instead, I wanted the system to be able to reconstruct the path:
individual 3Bet
→ population benchmark
→ observed difference
→ opportunities
→ confidence
→ supporting evidence
→ any counter-evidence
→ signal
This turns explainability from an interface detail into an architectural property.
Every conclusion must be traceable back to the evidence that generated it.
Metric confidence and signal confidence are not the same thing
Another important distinction emerges here.
Metric confidence concerns the robustness of a single statistic.
For example:
Fold to 3Bet = 65%
may have high confidence because it derives from a sufficient number of opportunities.
But the signal:
Overfold to 3Bet
may depend on multiple elements.
Not only on that statistic.
It could consider:
- distance from the population;
- behaviour by position;
- consistency with other metrics;
- any counter-evidence.
Consequently, the signal also has its own confidence.
We can have:
metric confidence: HIGH
but:
signal confidence: MEDIUM
because the overall evidence is not yet sufficiently convergent.
This separation prevents us from confusing:
“I trust the number”
with:
“I trust the interpretation I am building from that number.”
Supporting evidence and counter-evidence
One of the ideas I consider most important is that an intelligence engine should not look only for confirmation.
If I am evaluating the signal:
“overly tight blind defence”
I might find several metrics that support it.
But I might also find evidence pointing in the opposite direction.
This information should not be ignored.
It should be part of the model.
In conceptual terms:
supporting evidence
and
counter-evidence
both contribute to the confidence of the signal.
This is an important difference from a system built as a simple set of if statements.
Its task is not to prove that a rule is true.
It is to assess how strongly the available evidence supports a particular interpretation.
From signals to archetypes
When multiple signals begin to converge, we can move up another level.
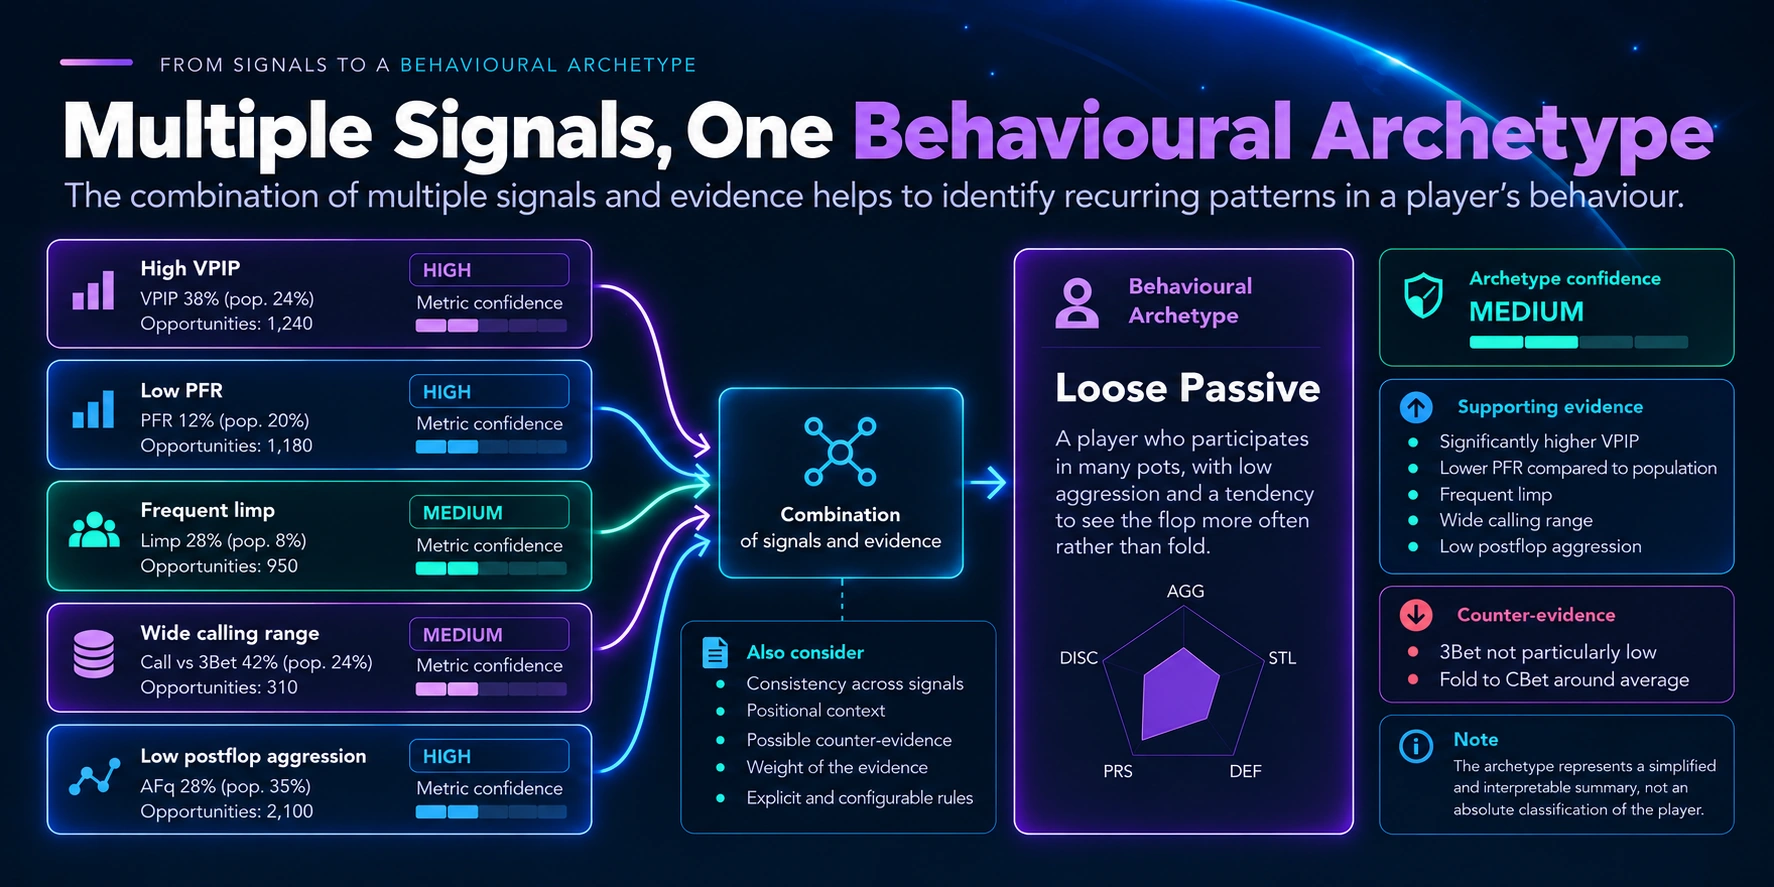
Imagine observing simultaneously:
- high VPIP;
- relatively low PFR;
- frequent limping;
- a wide calling range;
- low postflop aggression.
Each element tells us something.
But together they can describe a more recognisable behavioural pattern.
This is where the concept of an archetype emerges.
For example:
Loose Passive
But here too, the label must not become a verdict.
An archetype is a form of information compression.
It serves to summarise multiple signals in an immediately readable representation.
It does not mean:
“this player is definitively this type.”
It means:
“the evidence we have observed is currently compatible with this behavioural pattern.”
The risk of behavioural overfitting
The more rules we add, the greater the temptation becomes.
To build extremely specific interpretations.
But an engine that produces dozens of archetypes and hundreds of micro-signals risks recreating exactly the problem we started with.
Too much information.
Only shifted to another level.
The goal of the intelligence layer should not be to produce as many conclusions as possible.
It should be to produce a small number of useful conclusions that are sufficiently supported by evidence.
It is a form of compression.
We could start with:
100 metrics
and arrive at:
5 relevant signals
Not because the other 95 metrics are useless.
But because, at that moment, those five signals are the ones that deserve attention.
The rules must be explicit
Another architectural choice was to prevent interpretative logic from becoming scattered throughout the code.
If a signal exists because:
- a metric exceeds a certain threshold;
- the minimum sample requirement is met;
- the distance from the population is significant;
- there is no sufficiently strong counter-evidence;
these conditions should be recognisable.
Ideally:
explicit, versionable and testable.
Because interpretations change.
A threshold can be refined.
A benchmark can evolve.
A rule can prove too aggressive.
A new dataset can suggest a different interpretation.
If the intelligence logic is explicit, we can change it without rewriting history.
Persist facts, derive intelligence
This brings us back to a decision made much earlier, in the Data Engineering layer.
Persist facts, derive intelligence.
In the database, I want to preserve what happened:
- hands;
- players;
- actions;
- positions;
- results;
- events.
Statistics, signals and archetypes, by contrast, are interpretations.
They can change.
If I change the definition of a signal tomorrow, I do not want to have to modify historical events.
I want to be able to recalculate the intelligence from the same facts.
This separation allows the system to evolve.
The facts remain.
The interpretations can improve.
Explainability as an architectural requirement
At this point, explainability becomes unavoidable.
If I show a user:
“High multi-street pressure”
I must be able to explain:
- which metrics contributed;
- which benchmarks were used;
- how many opportunities were available;
- what confidence the metrics had;
- which evidence supports the signal;
- which evidence, if any, contradicts it.
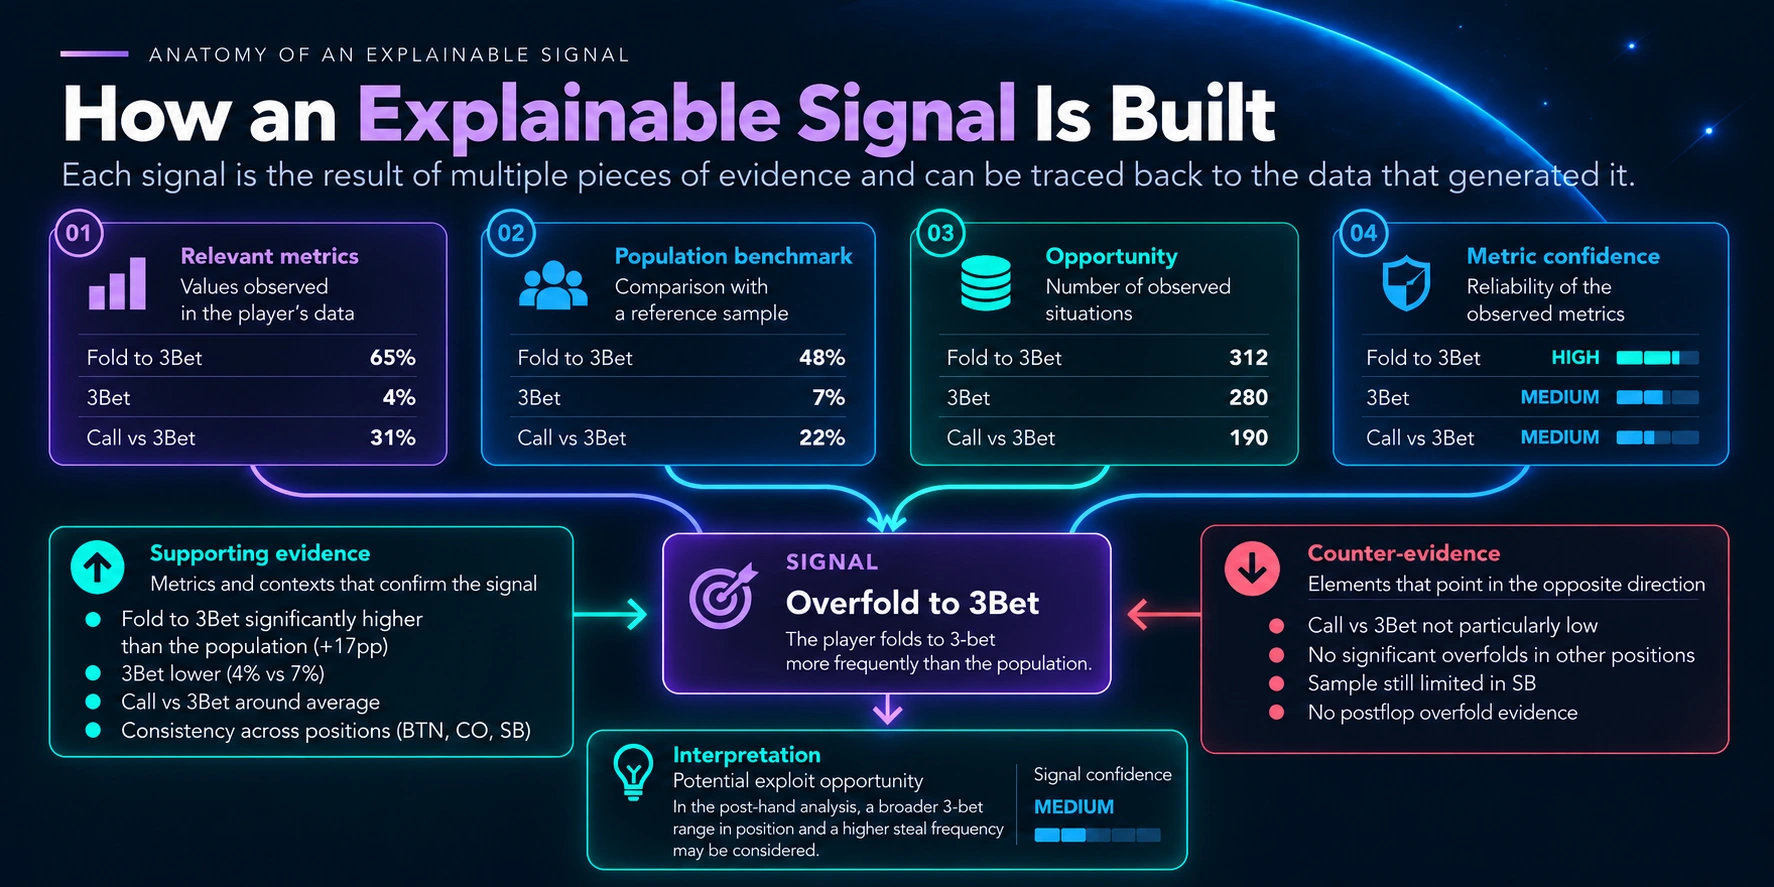
This is not only useful for creating trust in the interface.
It is also useful to me as a developer.
An explainable conclusion is:
- easier to test;
- easier to debug;
- easier to challenge;
- easier to improve.
Transparency therefore becomes both a product characteristic and an engineering tool.
Intelligence does not mean automating the decision
Having reached this point, it would be easy to make one final leap.
If the system can interpret behaviour, why not have it tell the user directly what to do?
But that was not my objective.
The intelligence layer was not intended to replace the decision.
It was intended to improve what comes before the decision.
Reduce noise.
Highlight anomalies.
Contextualise numbers.
Compress information.
Show evidence.
The result is not:
“take this action.”
It is something more like:
“this behaviour deserves your attention, and these are the reasons why.”
This is a distinction I consider important well beyond this project.
From data to decision, without skipping steps
Looking back, the pipeline has become progressively longer:
raw data
→ normalized facts
→ statistics
→ opportunities
→ confidence
→ population benchmark
→ signals
→ archetypes
→ intelligence
But none of these steps is decorative.
Each reduces a different form of uncertainty.
The data must be reliable.
The statistic must have an interpretable sample.
The value must have context.
The signal must have evidence.
The interpretation must be explainable.
Only then can the system genuinely help someone make a better decision.
And this is where, for me, analytics and intelligence cease to be synonyms.
Analytics shows what the data contains.
Intelligence attempts to make clear what deserves attention.
Without hiding the path that led there.
Originally published on LinkedIn on 6 September 2026. This edition is part of Lead From Tech Insights.