
In the previous Insight, Data Engineering: When the Problem Is Not Collecting Data, but Making It Reliable, I reached an apparently simple conclusion:
trust in the data comes before intelligence.
But having correct data does not yet mean being able to interpret it correctly.
A statistic can be calculated without errors, be mathematically impeccable and still be misleading.
Because a number, on its own, tells only part of the story.
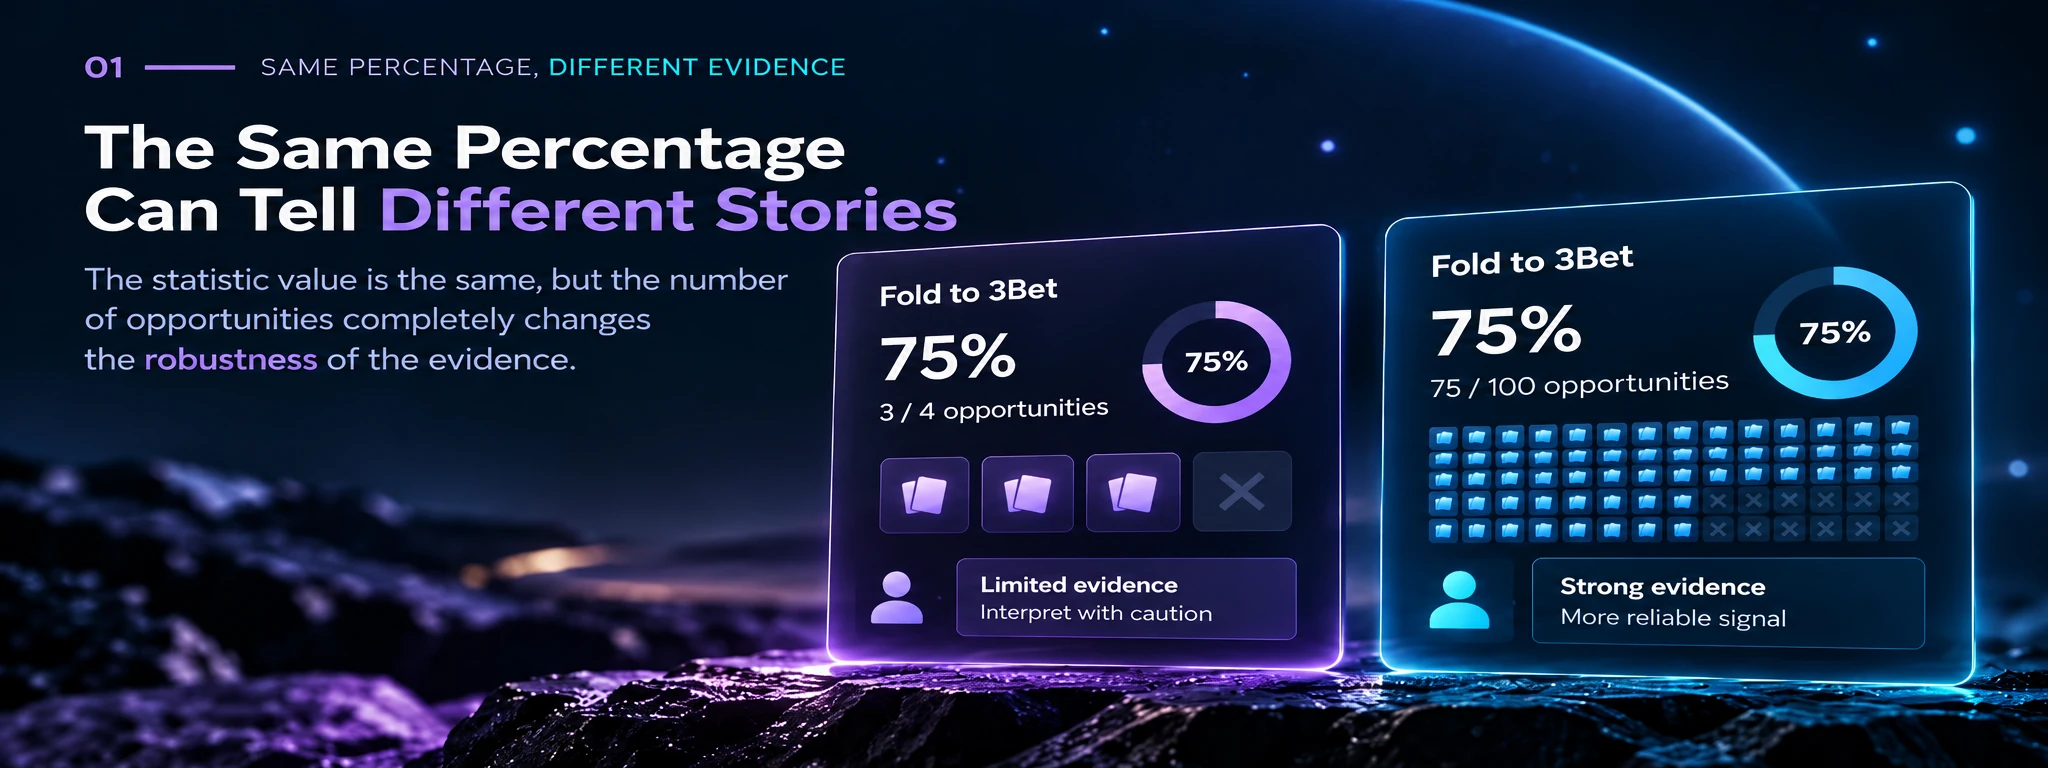
If a player has a Fold to 3Bet of 75%, the temptation is immediate:
“They fold too often to 3-bets.”
But 75% can mean:
3 folds out of 4 opportunities
or:
75 folds out of 100 opportunities
The percentage is identical.
The information we can draw from it is anything but.
A statistic is a relationship, not an isolated number
When we begin building an analytics system, it is natural to focus on percentages.
VPIP.
PFR.
3Bet.
Fold to 3Bet.
CBet.
Fold to CBet.
Steal.
Blind defence.
But almost none of these metrics comes simply from counting how many times something happened.
It comes from the relationship between:
observed events / actual opportunities
Take Fold to 3Bet.
It makes no sense to divide it by all hands played.
Nor by every occasion on which the player made an open raise.
The opportunity exists only when the required sequence occurs:
- the player opens;
- an opponent 3-bets;
- the action returns to the player;
- the player actually has the opportunity to decide.
Only then can we observe whether they fold, call or raise.
So the statistic is not simply:
number of folds
but:
folds / opportunities to fold to a 3-bet
This distinction seems trivial.
In reality, it completely changes how the statistical engine must be designed.
Opportunities are part of the domain
If I want to know how many times an event occurred, I can count.
If I want to know how often a player makes a particular choice, I must first understand how many times they could have made it.
And this requires domain knowledge.
To calculate a flop CBet, for example, it is not enough to find a bet on the flop.
We need to know who the preflop aggressor was, whether they reached the flop, whether they had the opportunity to bet and which action they took.
To calculate Fold BB vs Steal, we need to identify a steal situation, verify that the player was actually in the big blind and reconstruct the decision they made.
So an opportunity is not a statistical detail added at the end.
It is a property that emerges from reconstructing domain events.
And it is one of the reasons why, in the previous layer, I chose to preserve atomic events rather than conclusions that had already been calculated.
If the events are available, I can reconstruct not only what happened.
I can also reconstruct what could have happened.
The denominator changes the meaning
Imagine two players.
Both have:
Fold to CBet Flop = 80%
The first:
4 folds / 5 opportunities
The second:
80 folds / 100 opportunities
Displaying only:
80%
makes them appear identical.
Displaying:
80% (4/5)
and
80% (80/100)
immediately tells a different story.
Not because the first figure is necessarily wrong.
But because we have far less evidence for considering it representative of the player’s behaviour.
This led me to a very simple rule:
every behavioural percentage should be traceable to its numerator and denominator.
Not only for mathematical reasons.
Also for reasons of transparency.
Sample size: how many observations do we really have?
At this point, the second concept comes into play: sample size.
In poker, the sample problem is particularly evident.
We may have thousands of hands on a player and very few observations for a specific statistic.
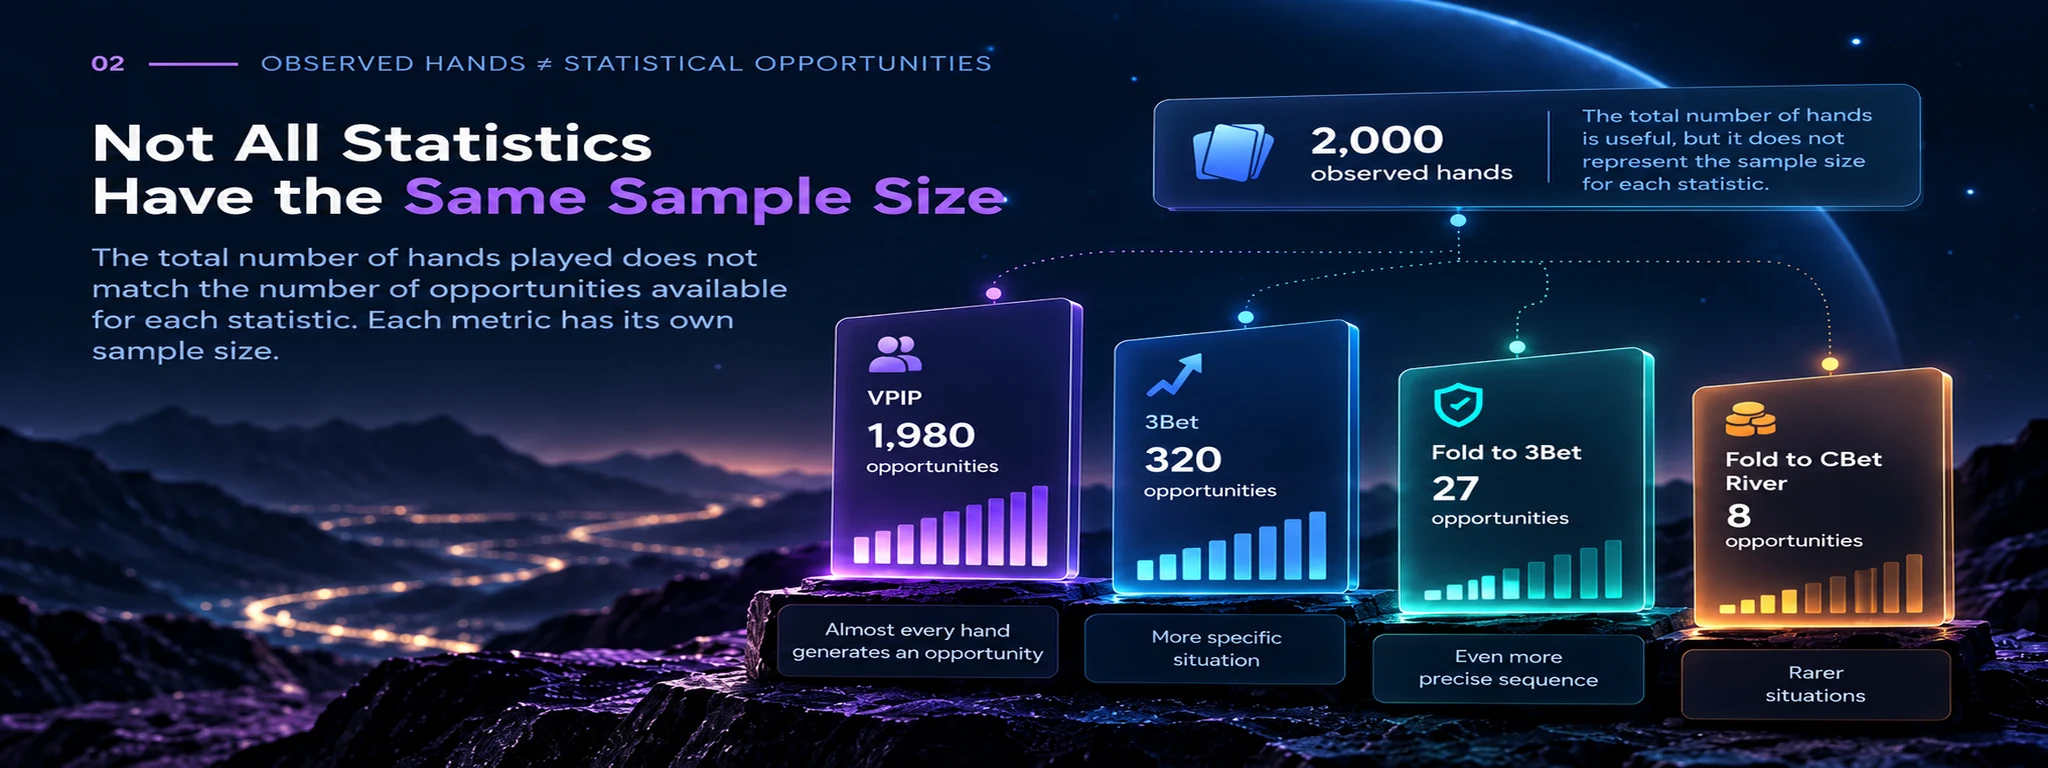
Because the total number of hands does not match the number of opportunities.
A player may have:
2,000 observed hands
but only:
27 Fold to 3Bet opportunities
and perhaps:
8 Fold to CBet River opportunities
This means that simply displaying:
“2,000 hands”
alongside every statistic can create a false sense of solidity.
The relevant sample size depends on the metric.
Every statistic has its own sample.
The more we segment, the smaller the sample becomes
The problem becomes even more interesting when we begin to segment.
An aggregate statistic may have a reasonable sample.
But if we ask about:
- behaviour by position;
- behaviour against a particular position;
- behaviour by street;
- behaviour in relation to stack size;
- behaviour in a specific action sequence;
the number of available observations decreases rapidly.
It is an unavoidable trade-off.
The more precisely we define the context, the more we reduce the amount of available data.
We can express it like this:
the more specific the question, the smaller the sample that can answer it tends to become.
This means that adding filters and segmentations does not automatically produce better insights.
Sometimes it simply produces statistics that are more precise in their definition, but much more fragile in their evidence.
From sample size to confidence
At this point, I had two pieces of information:
- the value of the statistic;
- the number of opportunities on which it was calculated.
But in the interface, I did not want to force the user to reinterpret the denominator every time.
Another layer was needed.
A concise representation of confidence.
Not as a promise of mathematical certainty.
Nor as an absolute judgement about the player.
But as an indication of how robust the system considers the available evidence for that specific interpretation.
Conceptually:
statistic + opportunities → confidence
For example:
Fold to 3Bet: 75%
on its own communicates a percentage.
Fold to 3Bet: 75% — 4 opportunities
adds context.
Fold to 3Bet: 75% — low confidence
makes it immediately clear that the value should be interpreted with caution.

Confidence does not mean truth
This point is fundamental to me.
A high confidence level does not mean:
“This interpretation is definitely true.”
It means something more limited:
“We have enough observed evidence to consider this interpretation more stable than one based on very few opportunities.”
Likewise, low confidence does not mean that the statistic is false.
A player who folds to 3-bets 3 times out of 4 may genuinely have that tendency.
The system simply does not yet have enough evidence to treat it in the same way as a tendency observed dozens or hundreds of times.
This distinction is important because it prevents the software from automatically turning:
a signal
into
a conclusion.
Not all statistics converge at the same rate
There is another consequence.
Opportunities do not arise with the same frequency for every metric.
VPIP and PFR generate observations very quickly because almost every hand contributes to the sample.
A 3Bet already requires a more specific situation.
Fold to 3Bet requires an even more precise sequence.
A river statistic may require a hand to pass through many conditions before generating a single opportunity.
This means that it would make no sense to treat every statistic with the same sample expectations.
The system must know that some metrics accumulate evidence quickly and others slowly.
And this is where the problem ceases to be only about UI.
It becomes part of the analytical model.
From the individual player to the population
The scarcity of individual observations opens up another possibility.
If I have few opportunities for an individual player, I can begin to compare that behaviour with what happens in the population.
Not to replace the individual data.
But to contextualise it.
I can ask:
- what is the average observed frequency?
- how far is this player from the population?
- how many observations support the individual behaviour?
- how many support the benchmark?
- is the difference consistent enough to become interesting?
The move from player statistics to population statistics changes the nature of the product.
I am no longer merely describing a player.
I am building a reference against which to interpret them.
And this is precisely where statistics begin to approach something different.
A signal.
A responsible UI must also show uncertainty
Finally, there is a design consequence that I consider important.
If the interface displays a percentage prominently and hides the fact that it derives from four observations, it is communicating more certainty than is actually available.
The problem is not mathematical.
It is communicative.
For this reason, sample size, opportunities and confidence should not be considered secondary metadata.
They are part of the information.
A good analytical interface should not limit itself to saying:
“This is the number.”
It should help us understand:
“How much can we trust this number in the context in which we are using it?”
The number is the beginning, not the conclusion
This phase of the project changed the way I look at statistics.
At first, the problem seemed to be calculating them correctly.
Then it became clear that reliable data was needed.
Then that every percentage had to be accompanied by its opportunities.
Then that the sample had to be interpreted.
And finally, that uncertainty also had to become visible.
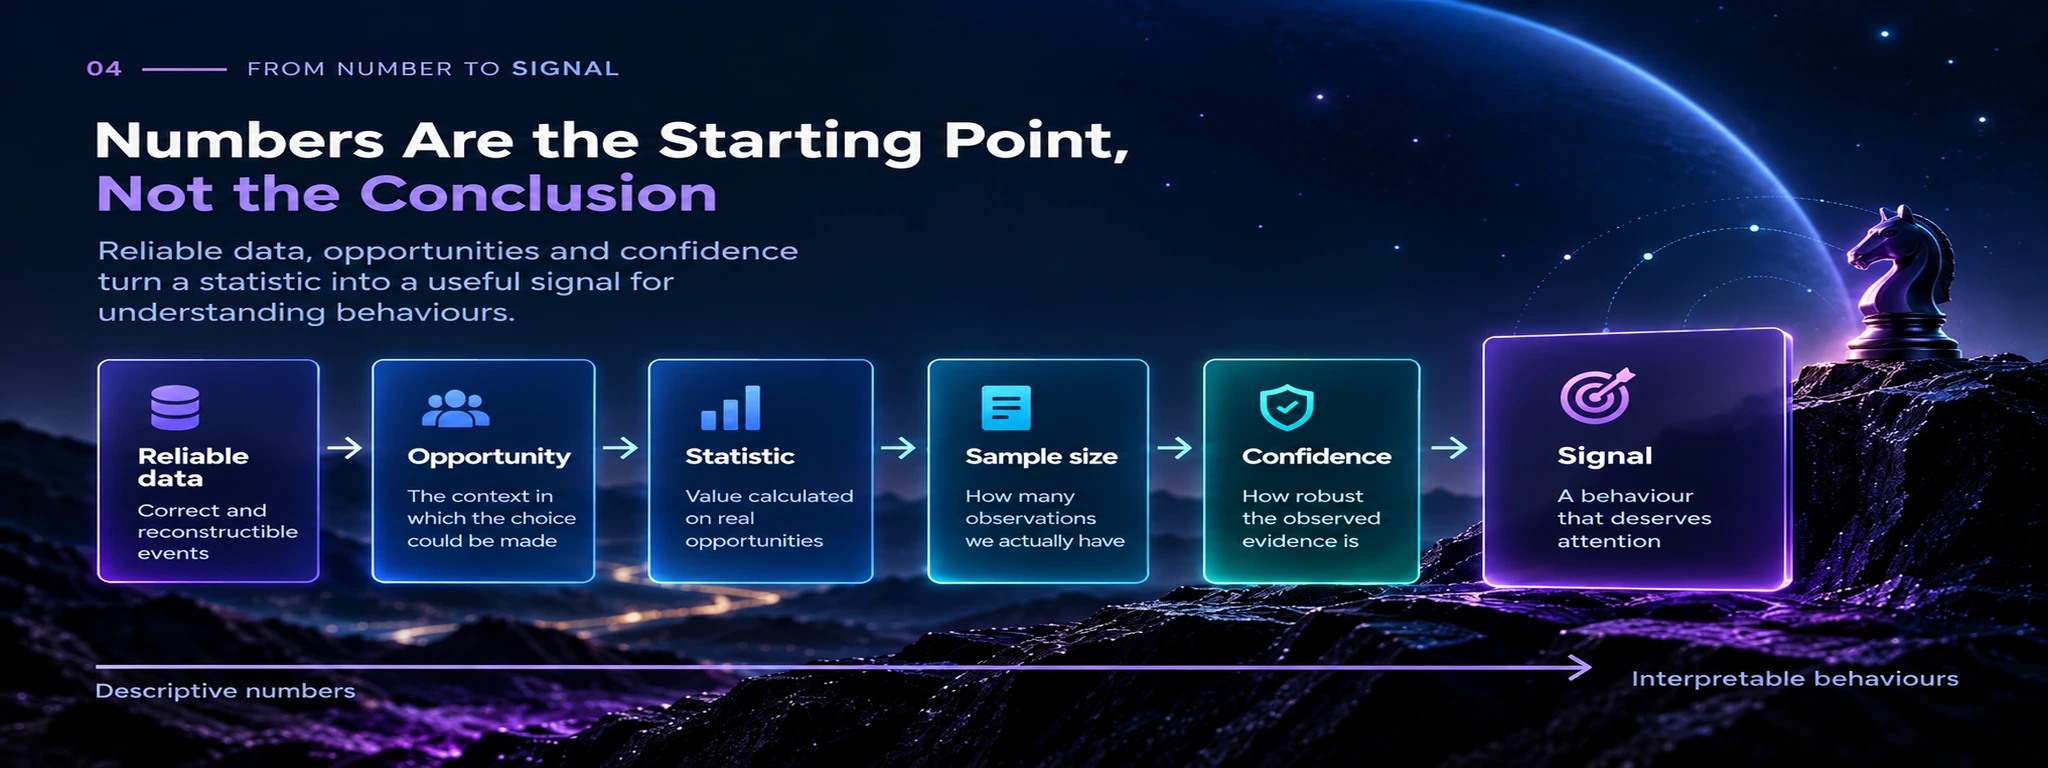
The progression, then, is not:
data → statistic → decision
It is closer to:
reliable data → opportunity → statistic → sample size → confidence → signal
And the signal is not yet a decision.
It is something that deserves attention.
The next step therefore becomes natural.
If the system can combine statistics, opportunities, confidence and comparison with the population, it can begin to do more than display numbers.
It can begin to interpret behaviours.
And that is where the project truly begins to move from statistics to intelligence.
Originally published on LinkedIn on 30 August 2026. This edition is part of Lead From Tech Insights.